Iterable
Cross-channel Analytics
In a short period of time, we were able to build a brand new, widely requested feature to help marketers better compare the effectiveness of their cross-channel campaigns.
Timeline
2020 (~9 weeks)
Team
Iterable
In a short period of time, we were able to build a brand new, widely requested feature to help marketers better compare the effectiveness of their cross-channel campaigns.
Timeline
2020 (~9 weeks)
Team
Our competitors also provided the ability to view cross-channel analytics so we knew it was necessary to build this feature as soon as possible.
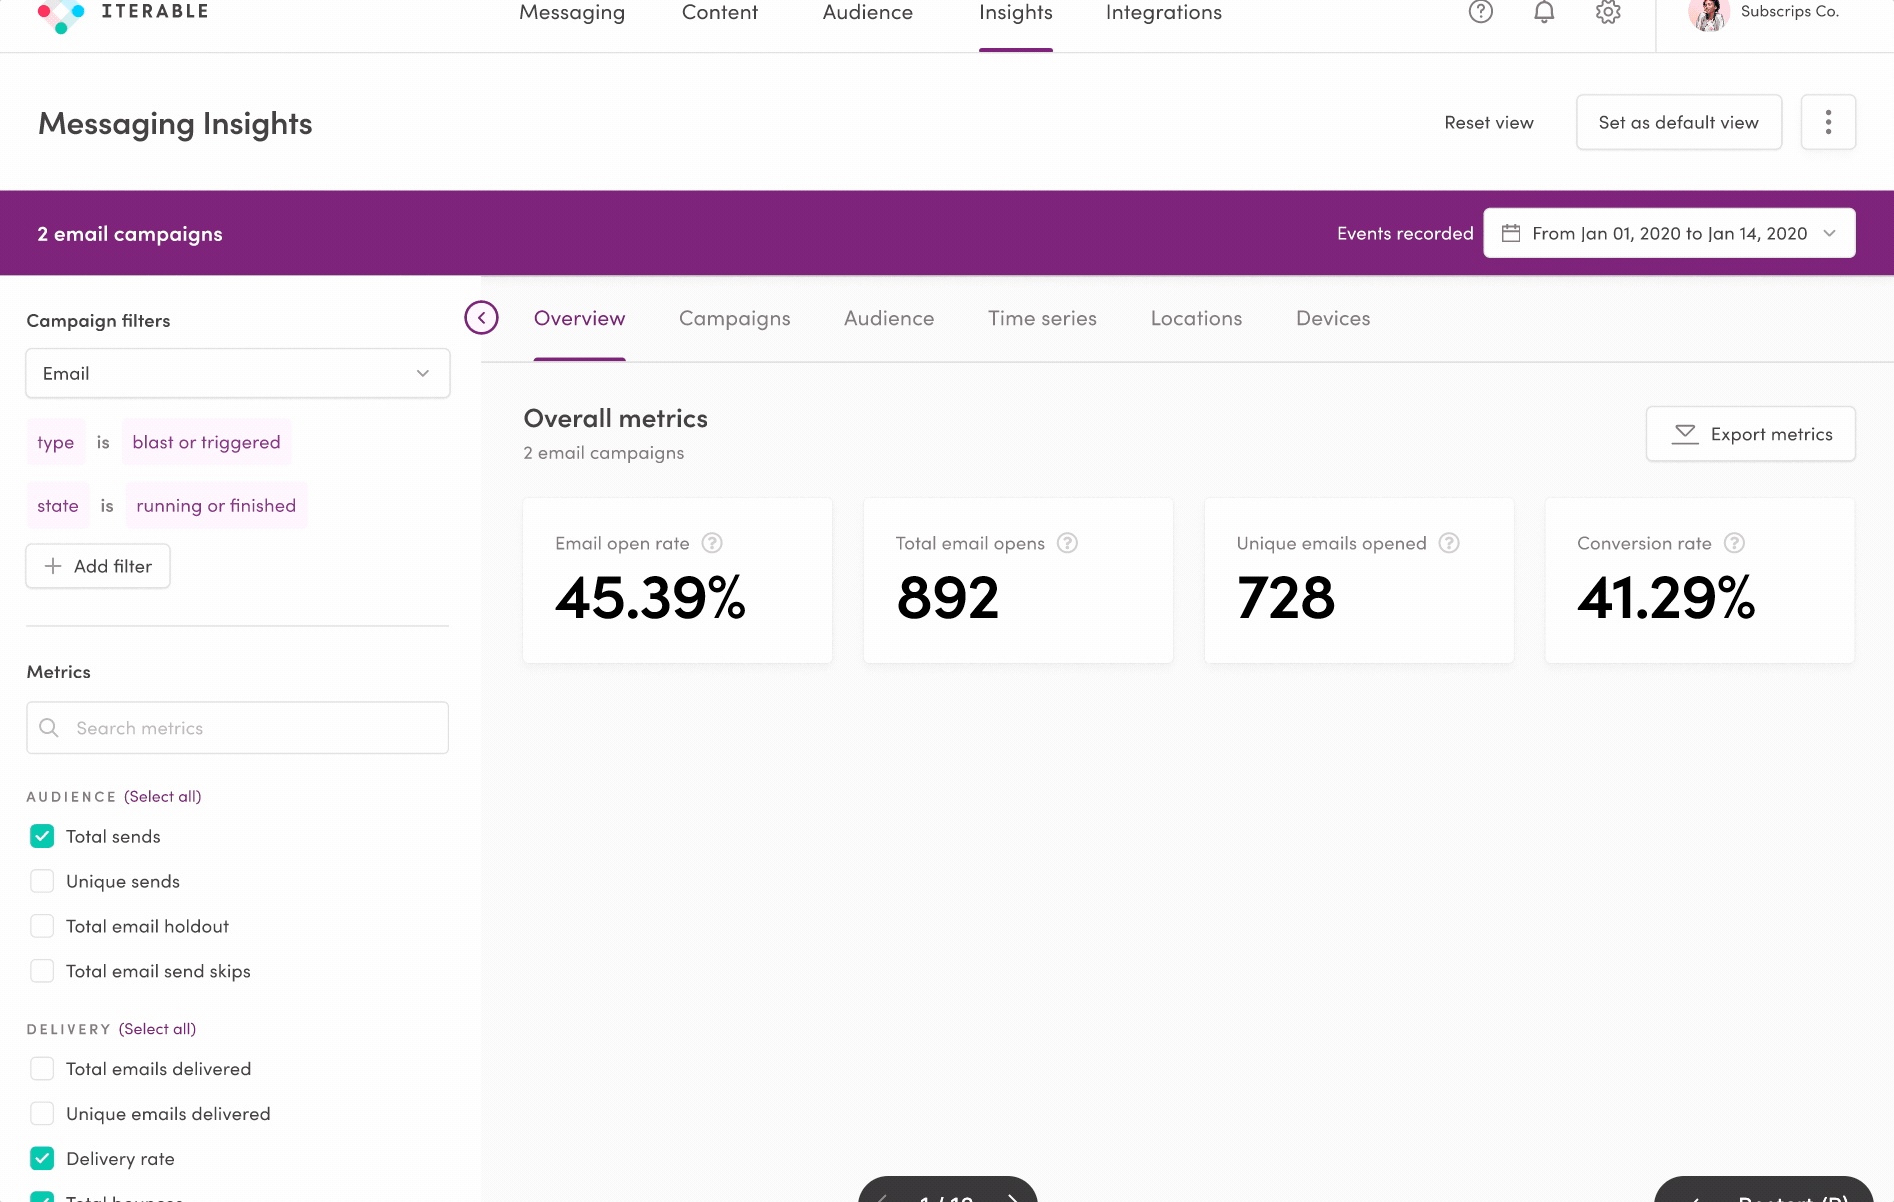
Previous design that only supported one channel at a time
After a few months into the release, we received a lot of positive sentiment from our customers and also achieved our goal of having customers with cross-channel campaigns using this feature on a regular basis.
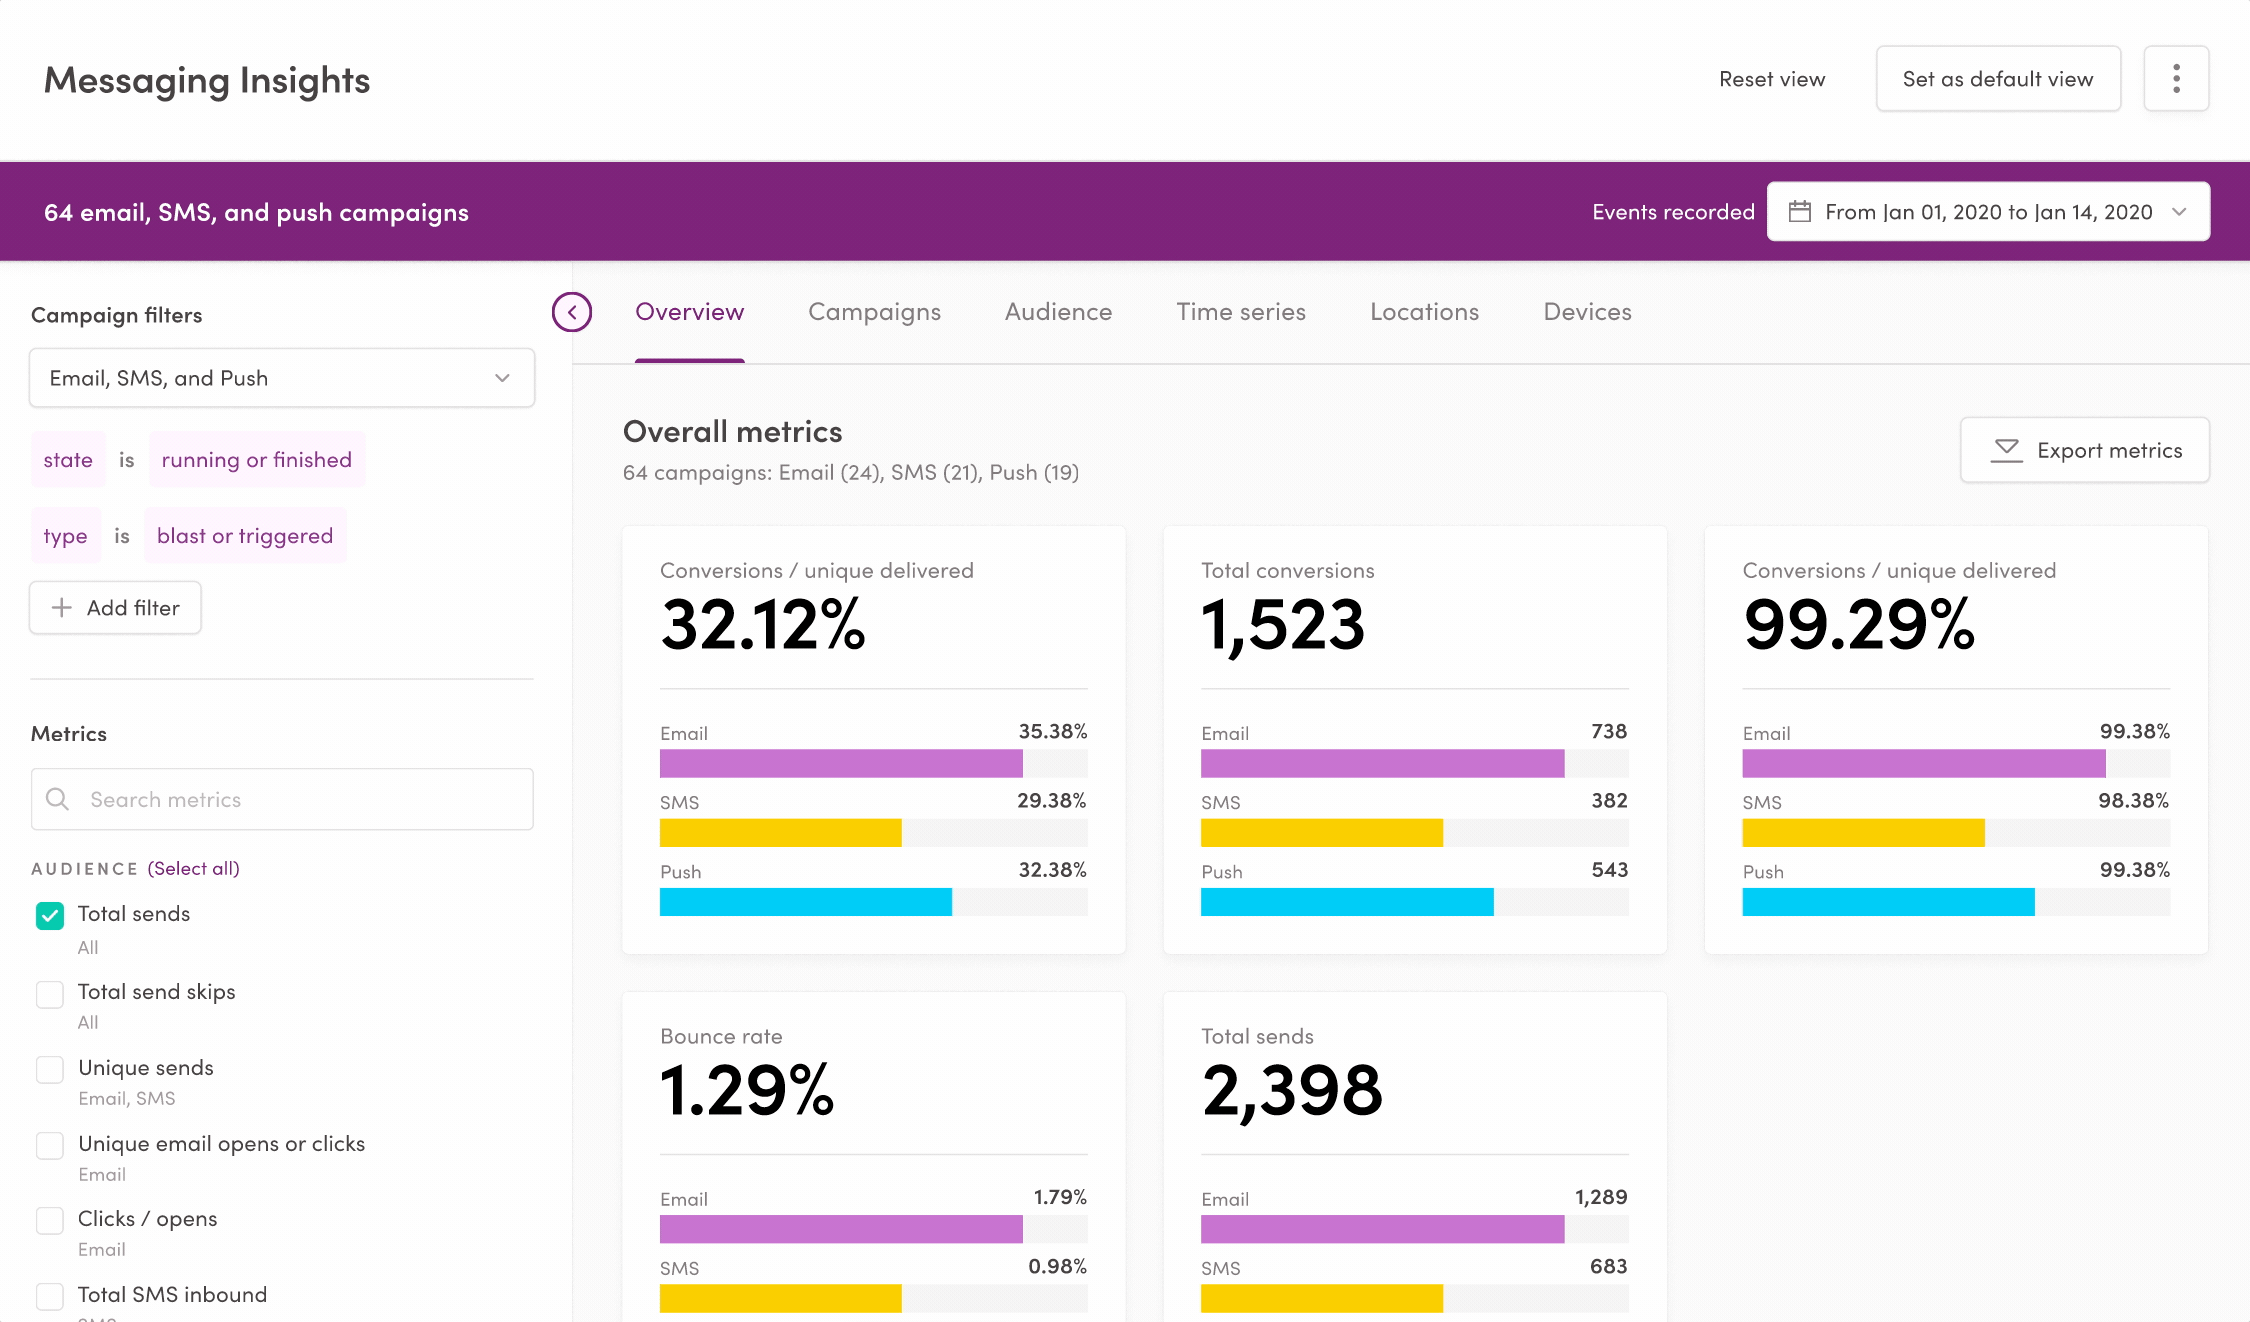
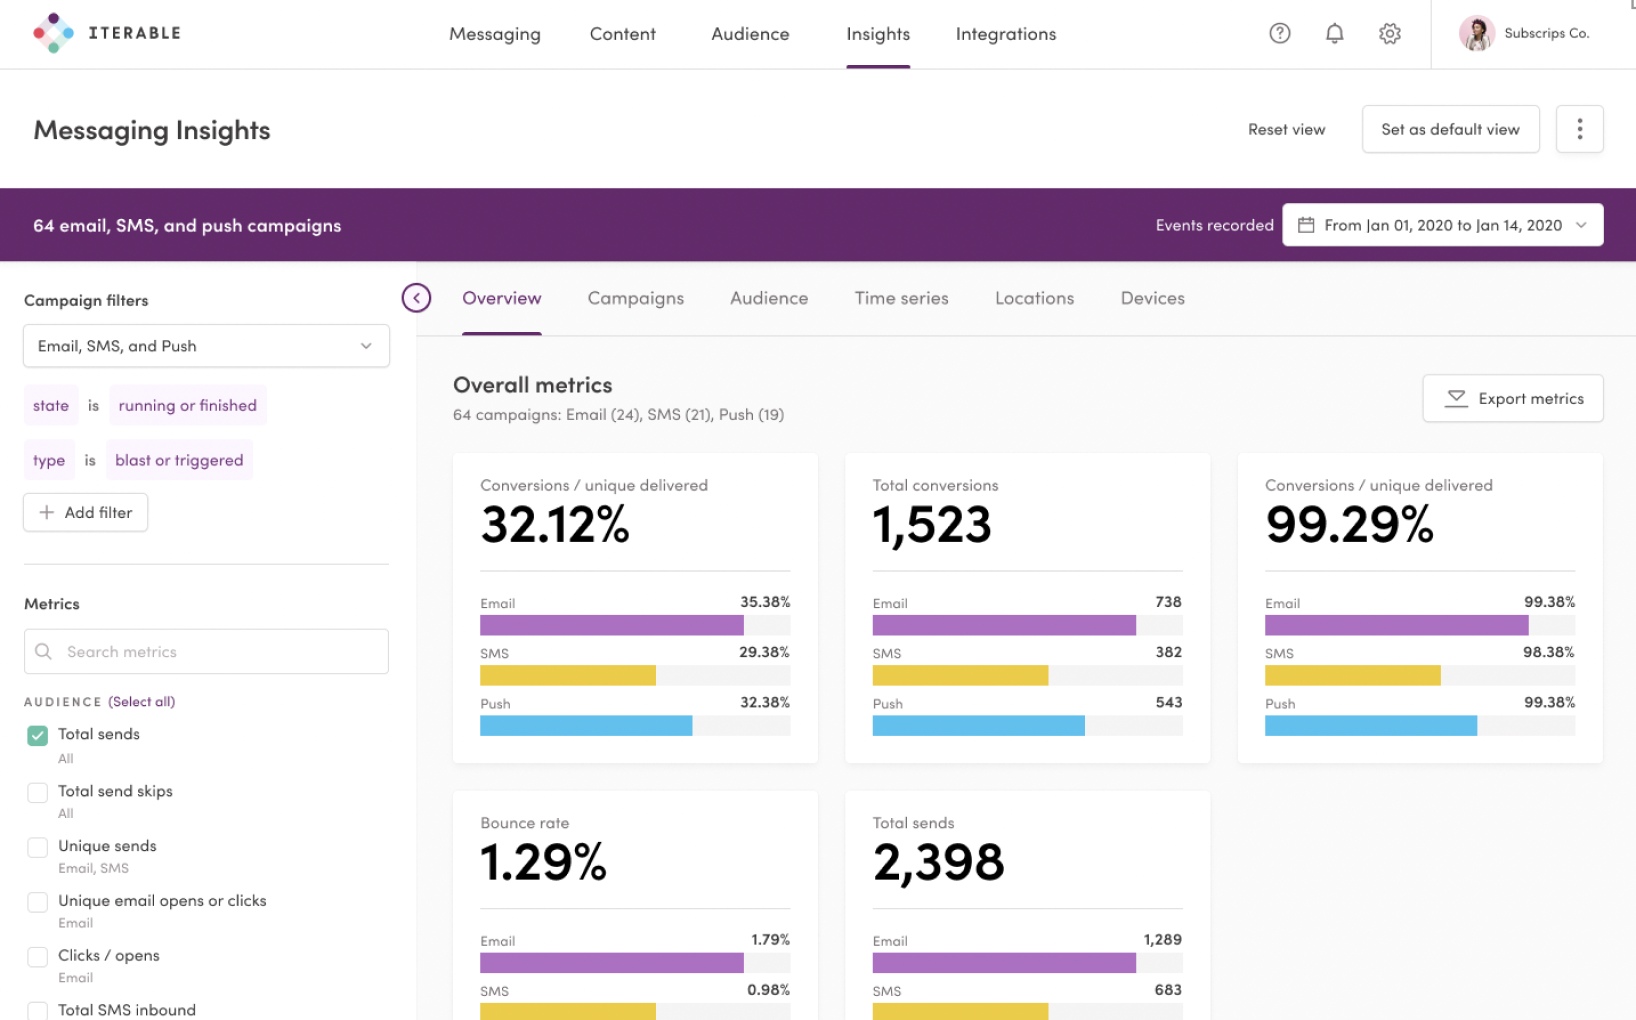
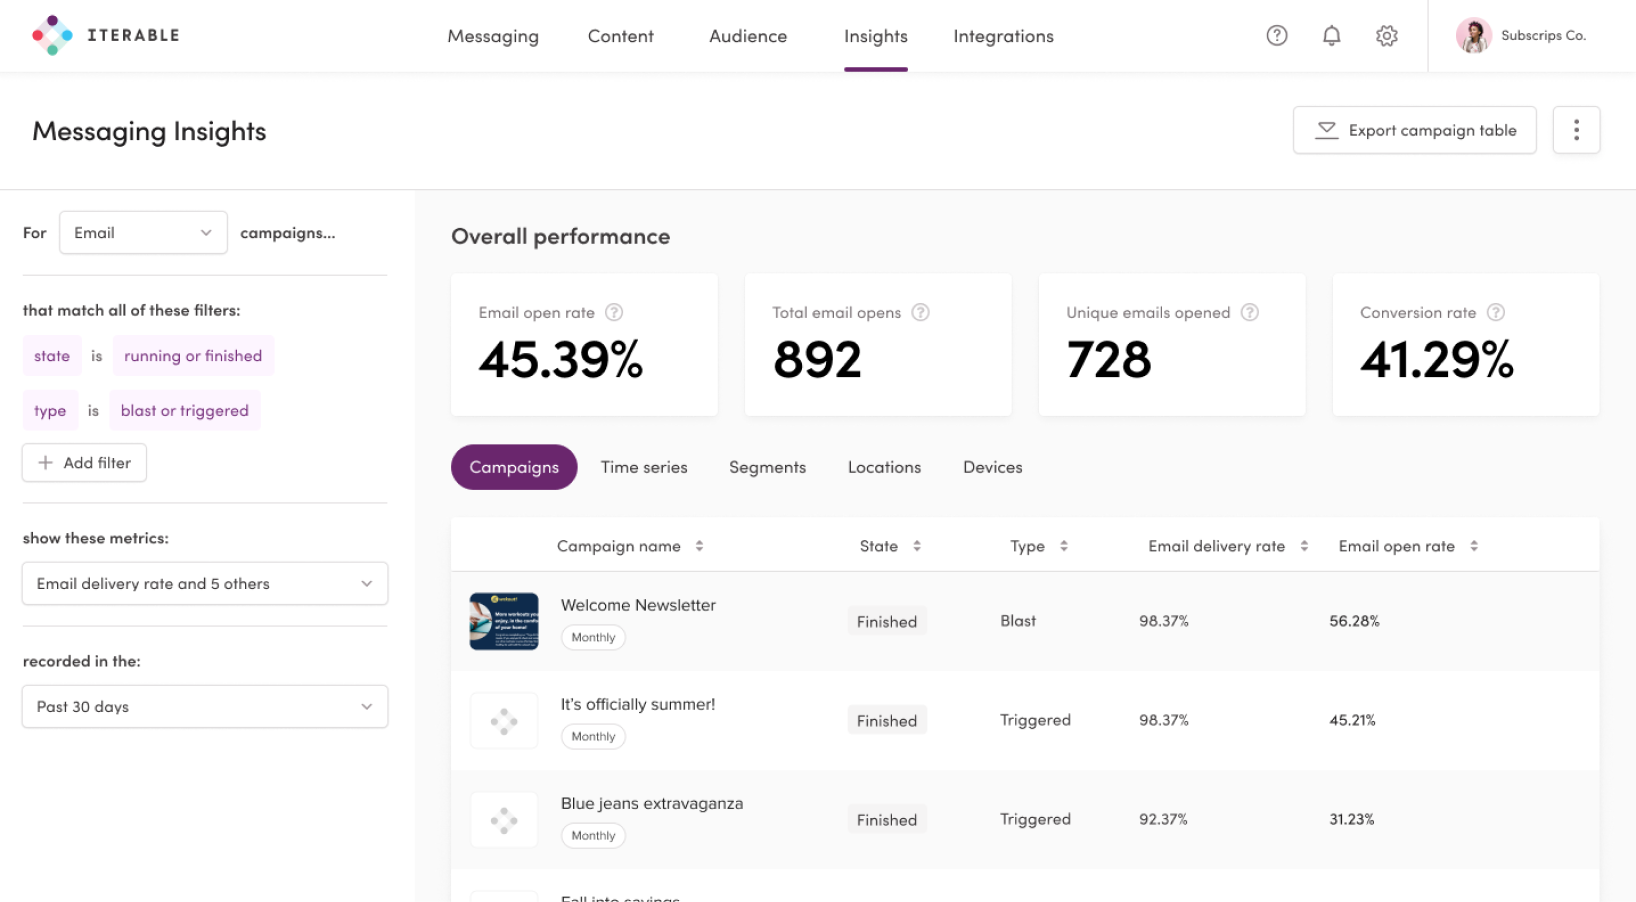
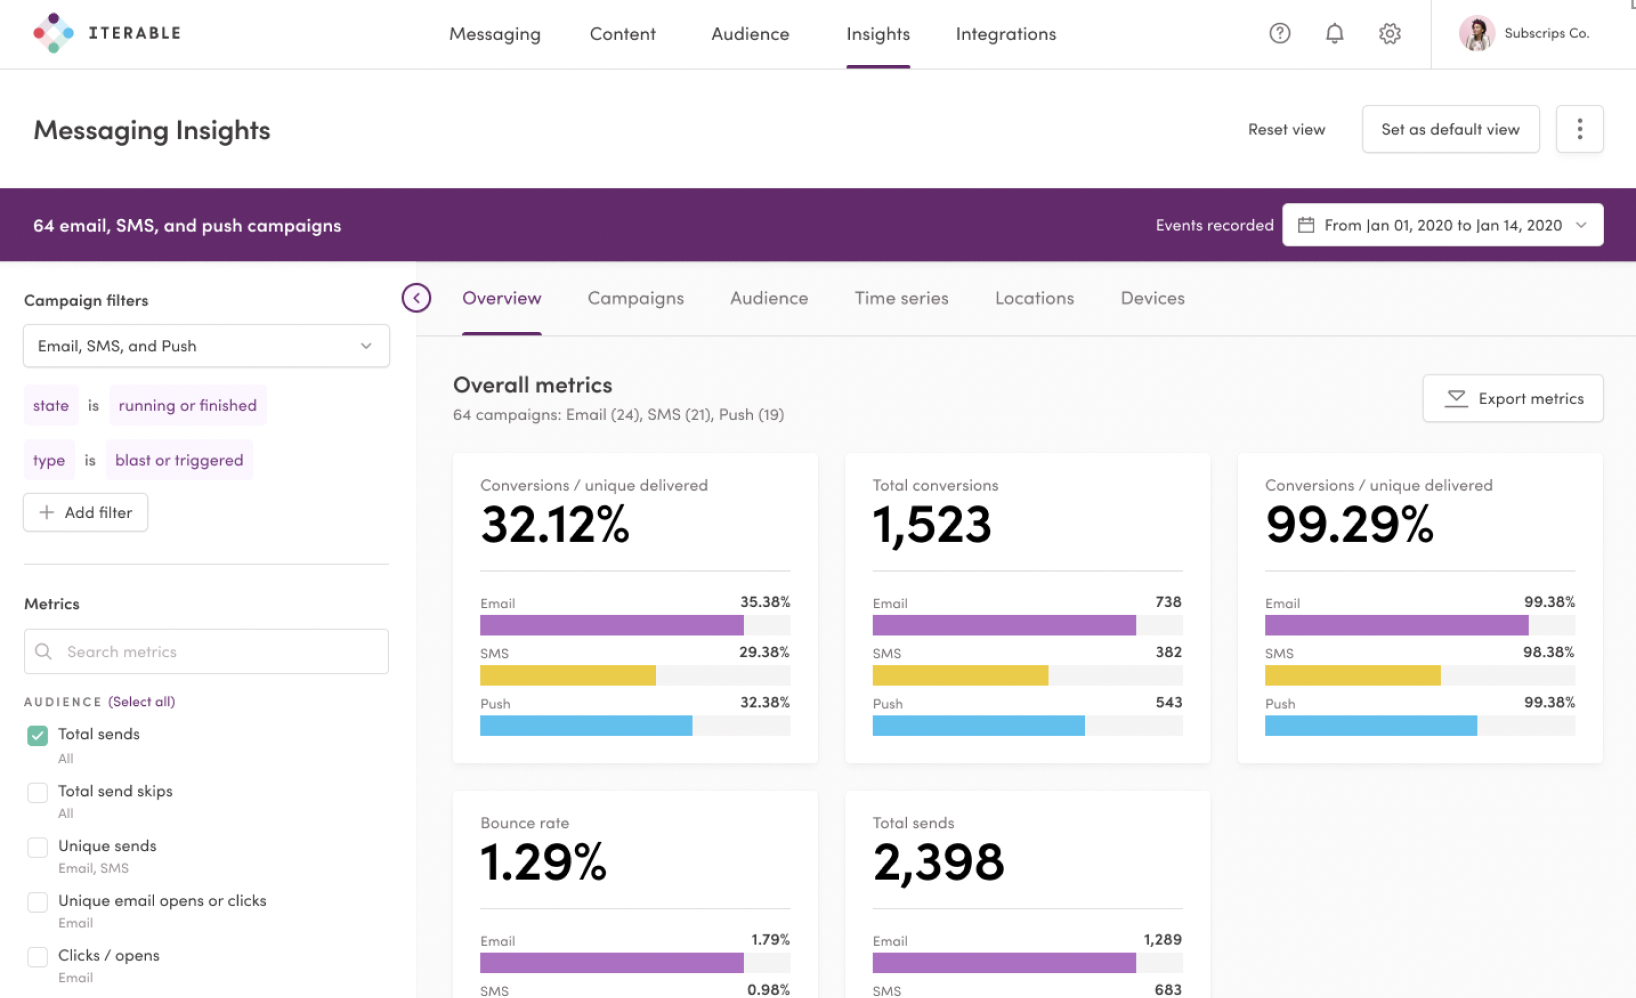
The final Cross-channel analytics feature
Due to time constraints, we conducted research in a scrappy way and were able to pull together insights from several places. We discovered the following:
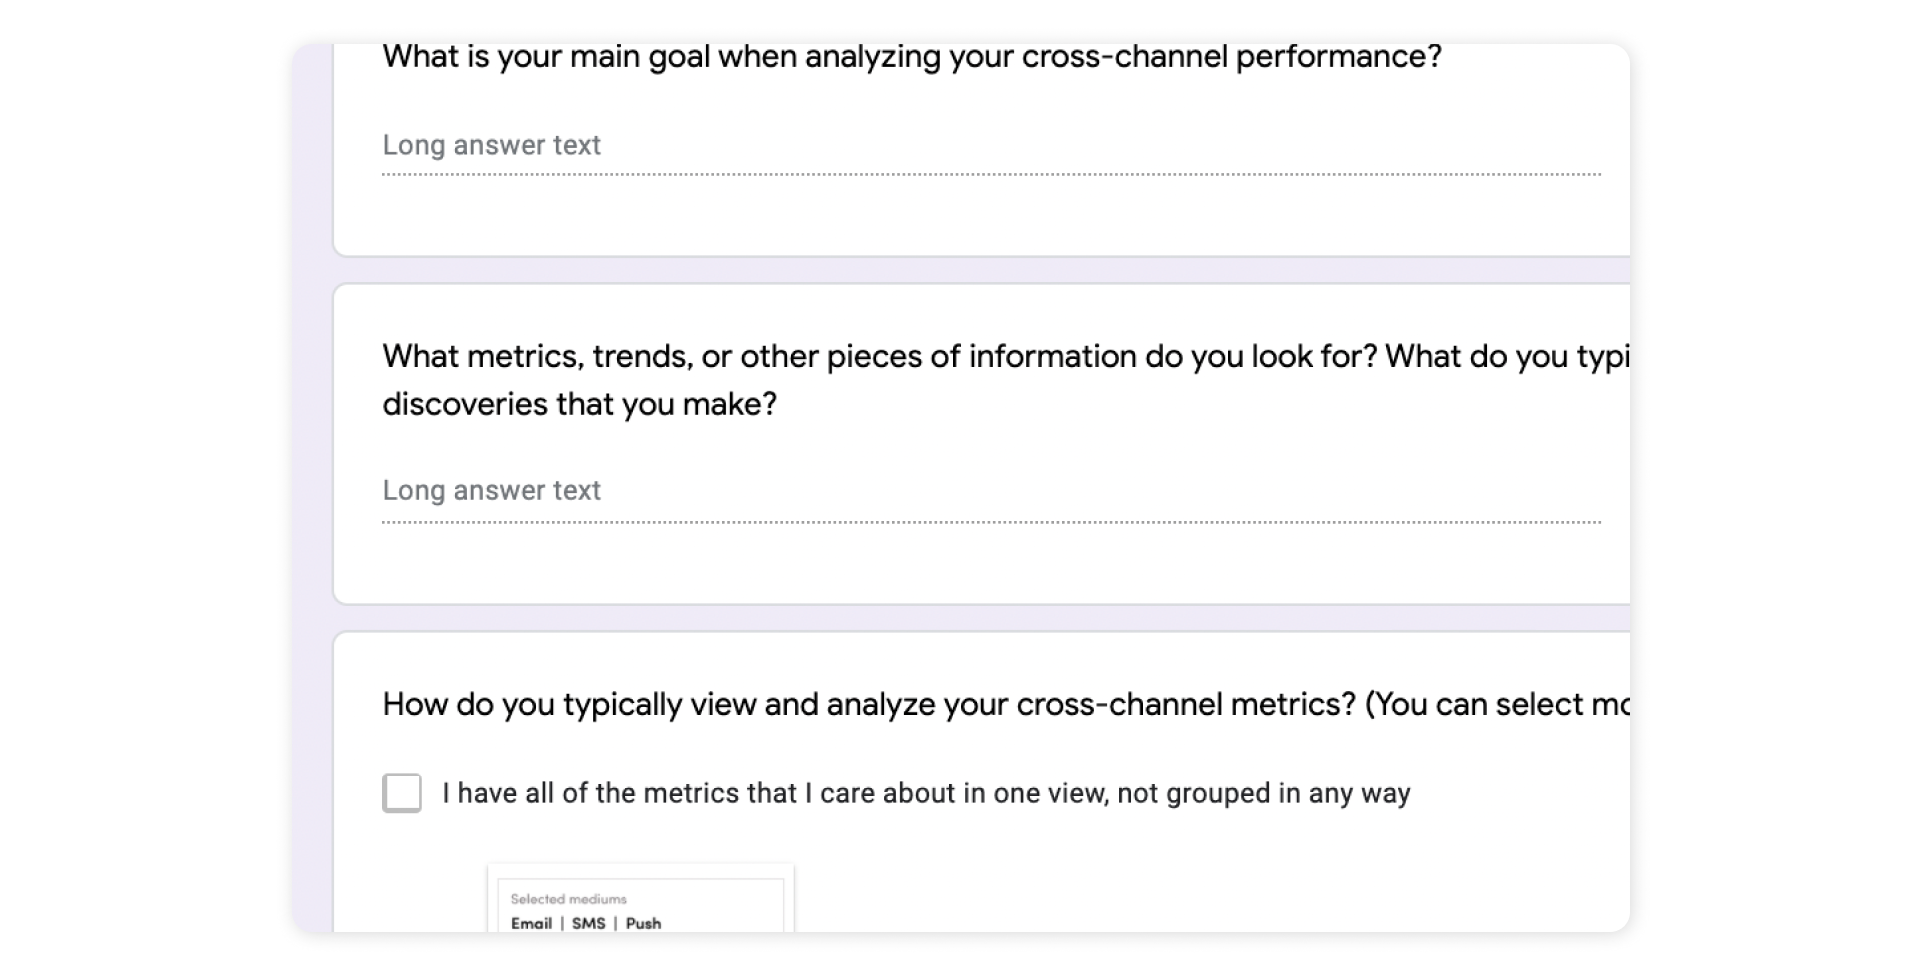
A snippet of our survey
During this process, I made sure to design the cross-channel experience side by side with the single channel experience, repurposed existing components as much as possible, and prototyped all transitions to make sure the views were cohesive.
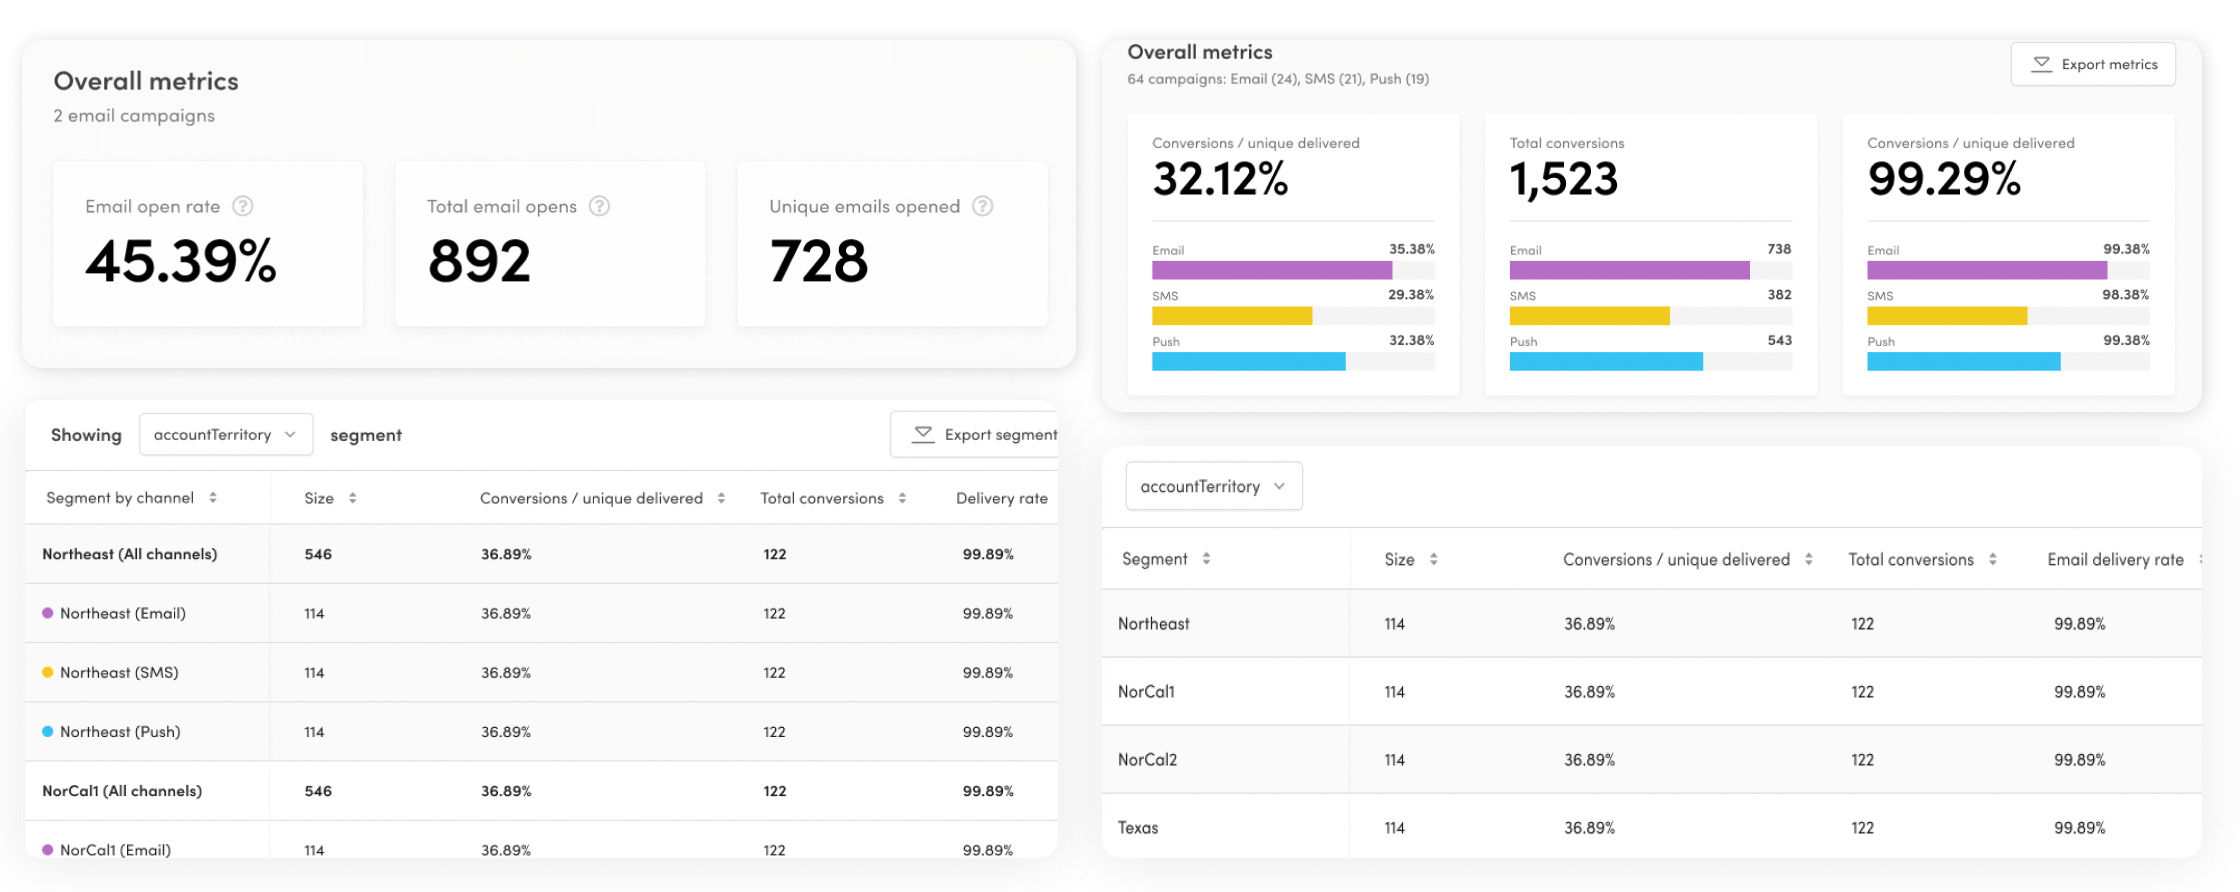
Comparing single and cross-channel cards and tables
Transition from the single to cross-channel experience
For the overview cards, I designed them with a visual to allow for the quick understanding of performance. I also surfaced both aggregate metrics and breakdown metrics by channel.
Final card designs
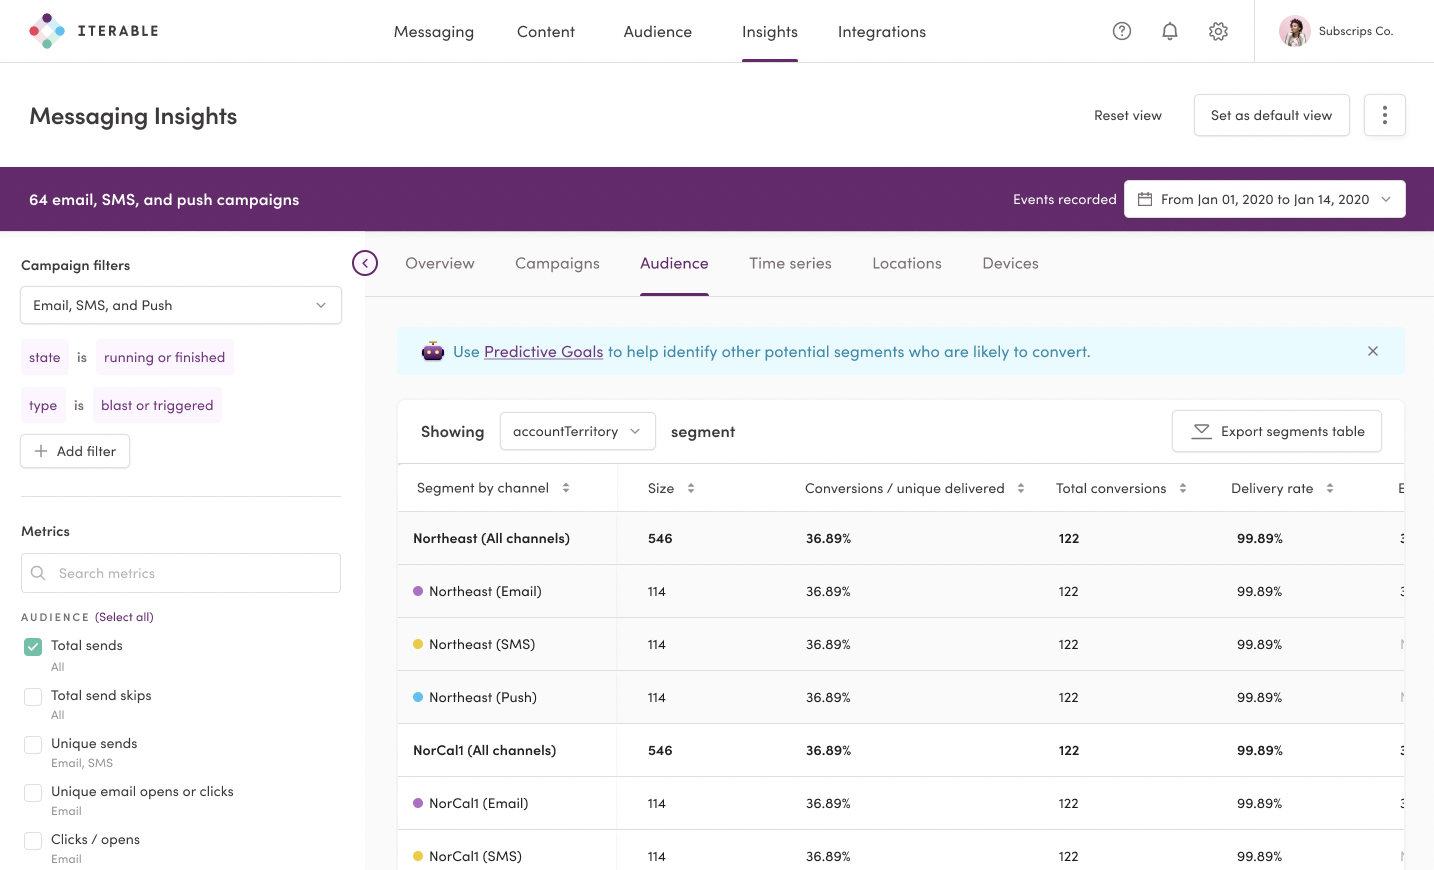
Audience segment table
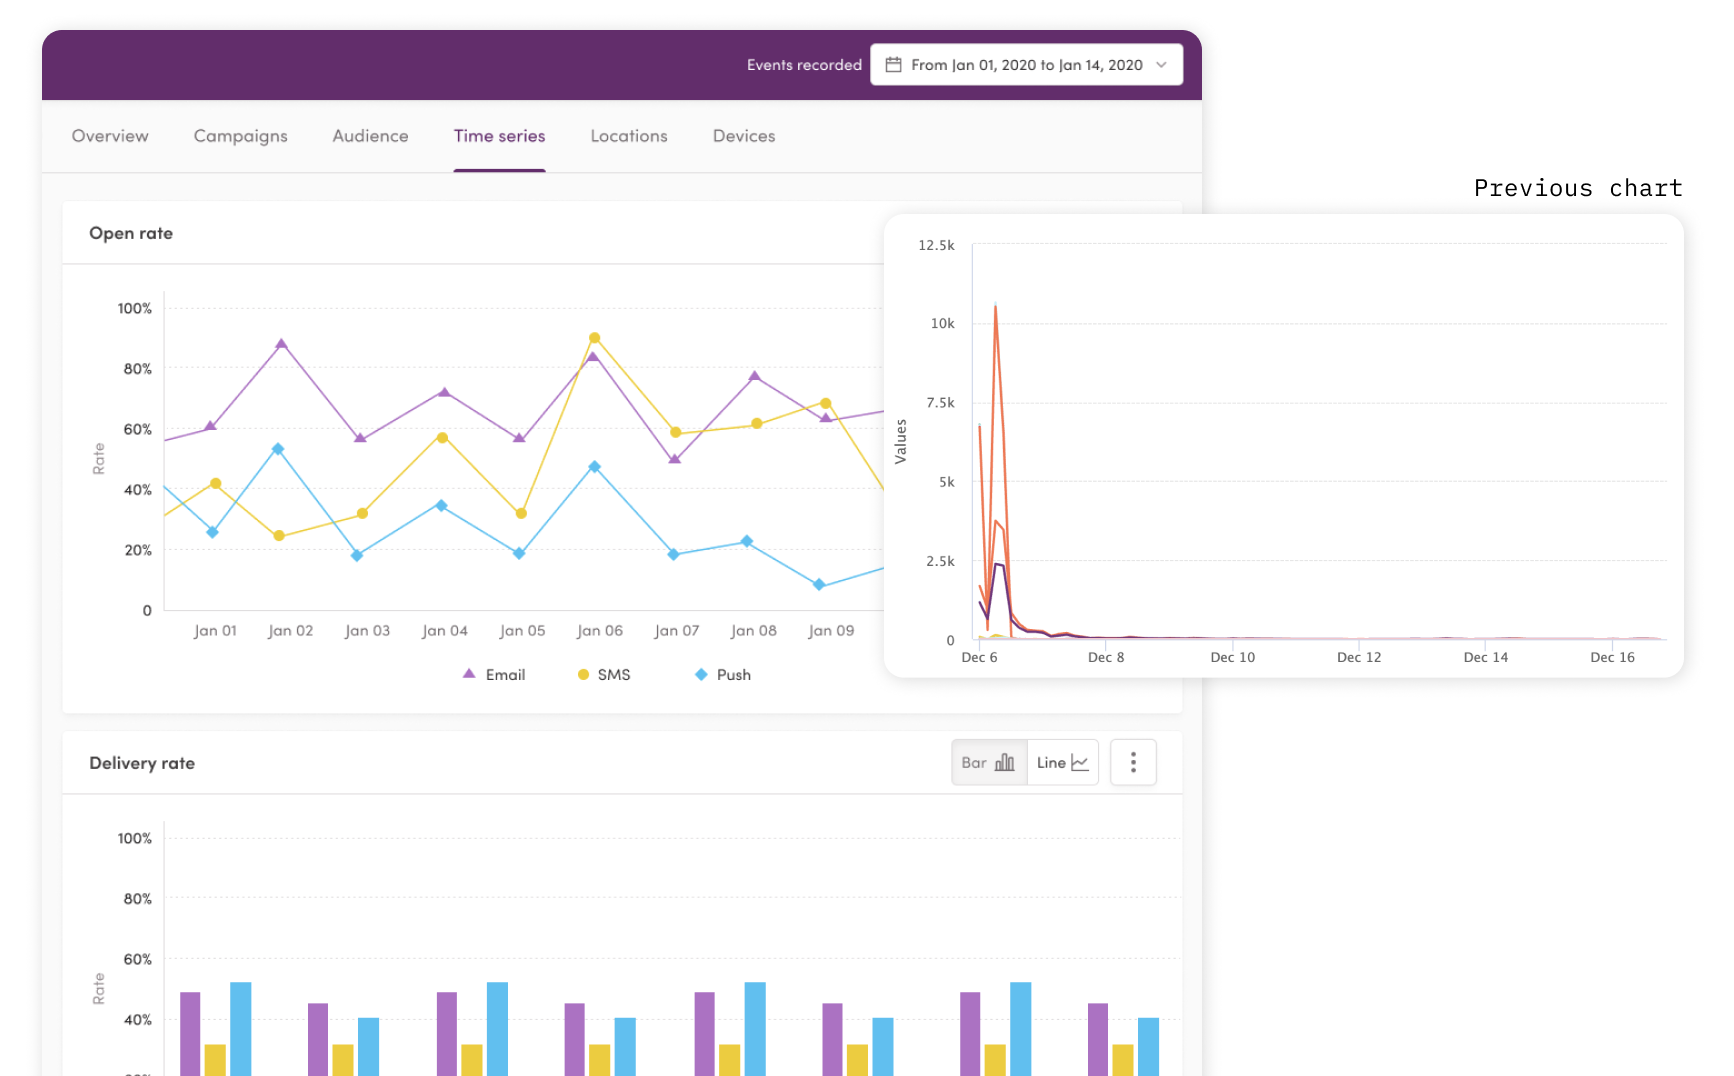
Improved charts along with previous chart